One-way ANOVA
Manual and Pythonic

By Sajeewa Pemasinghe
This method is used to find if there is a significant difference between the means of three or more groups at a given confidence level.
As the name ‘ANOVA’ suggests, this method analyses the variance in order to come to a conclusion. What type of variance? There are two types of variances:
- Between group variance
- Within group variance
So after finding these variances what does the method do? The following equation shows what the method does with the above two variances to come up with a statistic known as the F statistic.
F=\frac { Between\quad Group\quad Variance }{ Within\quad Group\quad Variance }\quad \quad \quad \quad \quad\quad\quad(1)
Let’s try to understand the calculation via an example.
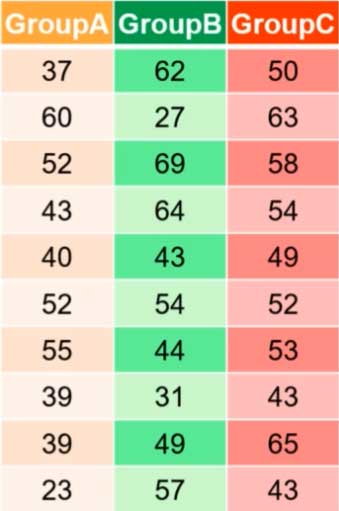
30 students at a university were selected for an informal study about student study skills; 10 first year (Group A), 10 second year (Group B), 10 third year (Group C) undergraduates were randomly selected.
The students were given a study skills assessment. As researchers, we are interested in whether or not a difference exists somewhere between the three different year levels. We will conduct this analysis using the One-way ANOVA technique.
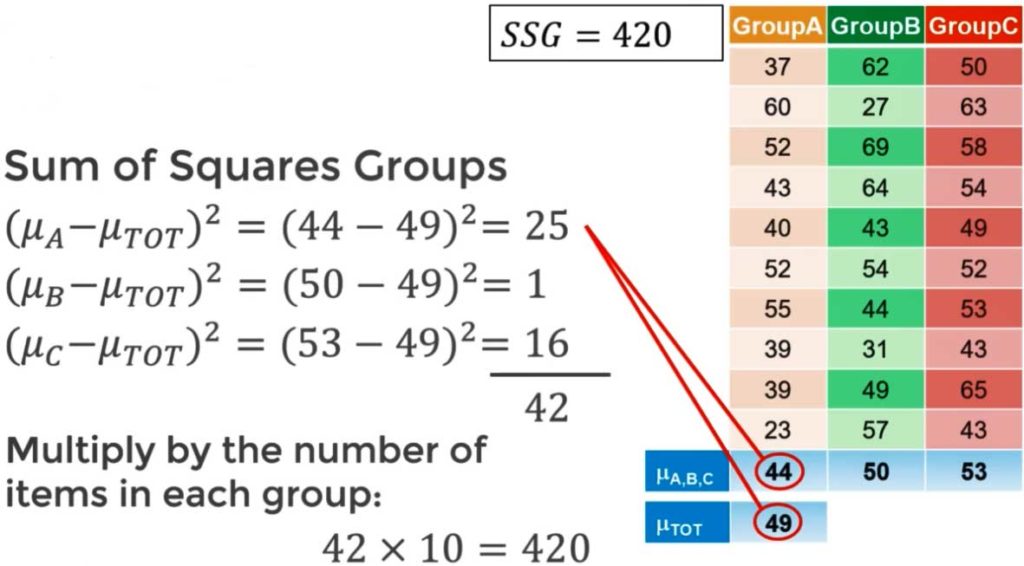
- Sum up the 30 scores and divide by 30 to find the overall mean ={ \mu }_{ TOT}=49
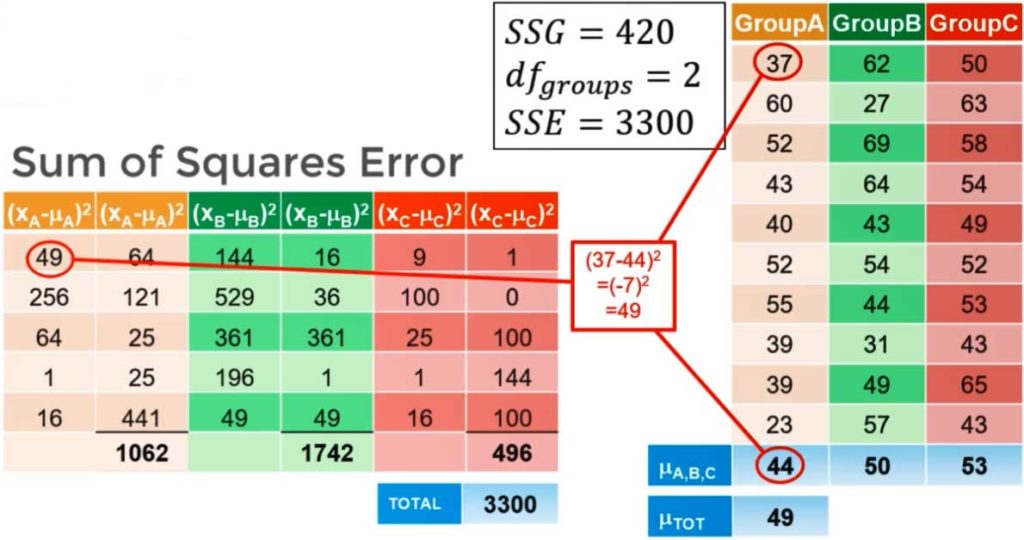
- Calculate SSG
- Find the difference between each group mean and the overall mean
- Square the deviations
- Add them up
- Multiply by the number of items in each group
- Calculate { df }_{ groups }
{ df }_{ groups }\quad =\quad Number\quad of\quad groups\quad -\quad 1
{ df }_{ groups }\quad =\quad 3\quad -\quad 1\quad =\quad 2 - Finally calculate the ‘between group variance’between\quad group\quad variance\quad =\quad \frac { SSG }{ { df }_{ groups } }
between\quad group\quad variance\quad =\quad \frac { 420 }{ 2 }
- Find the difference between each data point and its group mean
- Square each deviation
- Add up all the squared deviations to get SSE (30 squared deviations in this case)
- Calculate { df }_{ error }
\small{{ df }_{ error }\quad =\quad Number\quad of\quad data\quad points\quad -\quad Number\quad of\quad groups}
\small{{ df }_{ error }\quad =\quad 30\quad -\quad 3\quad =\quad 27} - Finally calculate ‘within group variance’
within\quad group\quad variance\quad =\quad \frac { SSE }{ { df }_{ error } } within\quad group\quad variance\quad =\quad \frac { 3300 }{ 27 }
Calculate the F statistic using equation (2)
F=\frac { \left( \frac { SSG }{ { df }_{ groups } } \right) }{ \left( \frac { SSE }{ { df }_{ error } } \right) } =\frac { \left( \frac { 420 }{ 2 } \right) }{ \left( \frac { 3300 }{ 27 } \right) } =\frac { 210 }{ 122.22 } =1.718
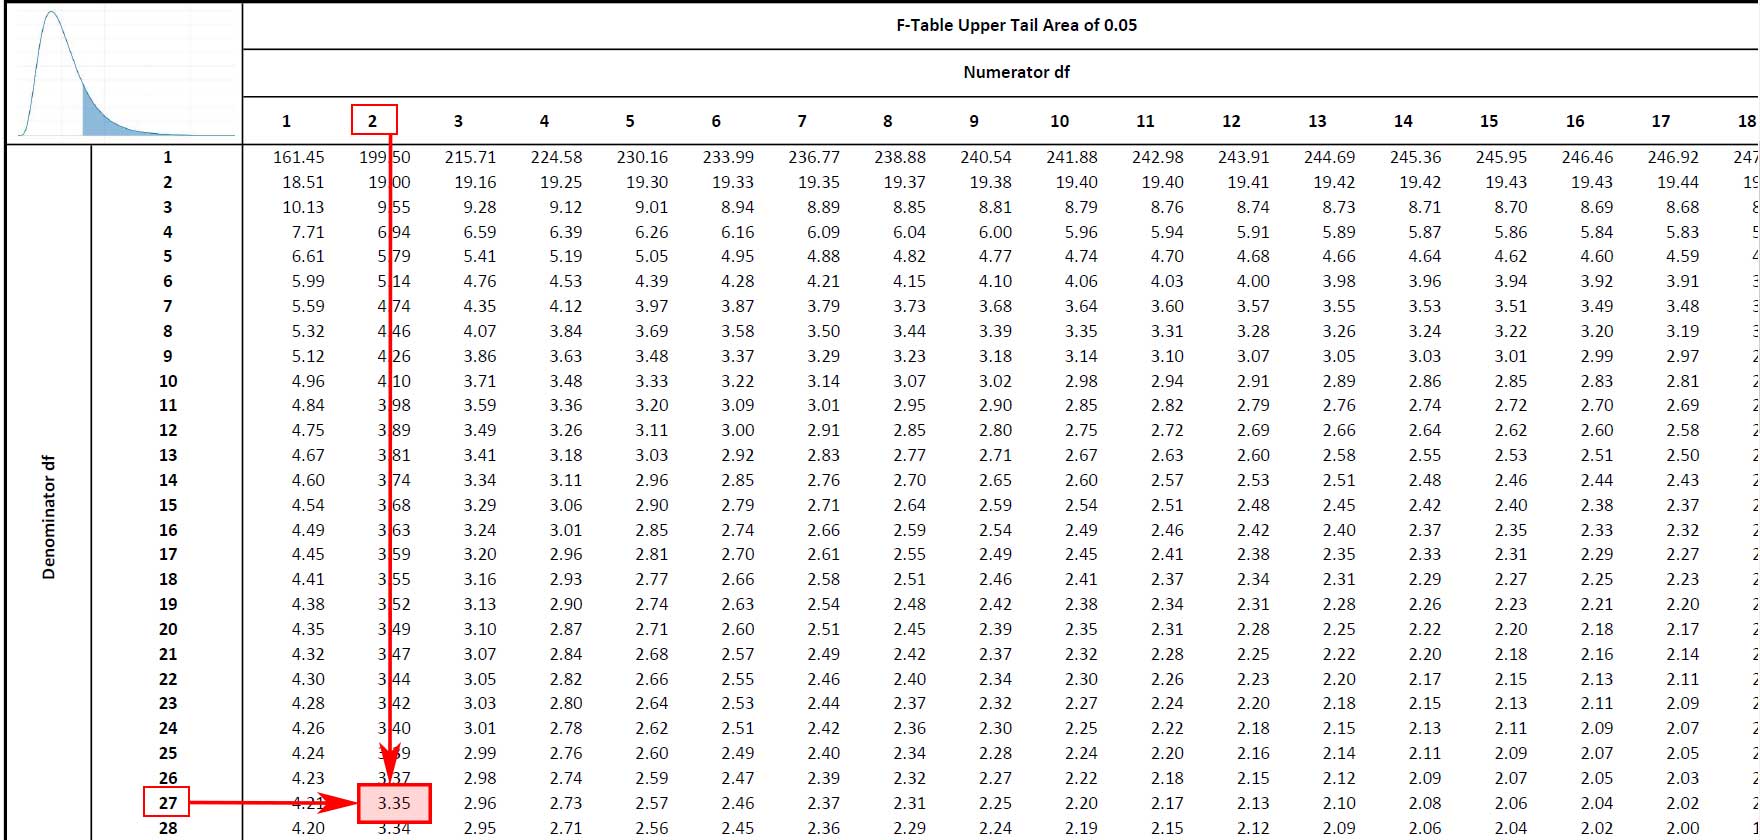
F table lookup for numerator (groups) degrees of freedom = 2 and denominator (error) degrees of freedom = 27, at alpha = 0.05
Conclusion
Our null hypothesis: { H }_{ 0 }:\quad { \mu }_{ A }\quad =\quad { \mu }_{ B }\quad =\quad { \mu }_{ C }
But F is less than { F }_{ critical }:\quad1.718<3.35
Therefore we fail to reject the null hypothesis!
Using Python programming language
from scipy.stats import f_oneway

groupA = [37, 60, 52, 43, 40, 52, 55, 39, 39, 23]

groupB = [62, 27, 69, 64, 43, 54, 44, 31, 49, 57]

groupC = [50, 63, 58, 54, 49, 52, 53, 43, 65, 43]

F_value, p_value = f_oneway(groupA, groupB, groupC)

print(F_value, p_value)
In our case the F_value variable gives 1.718 and the p_value variable gives 0.198. This 0.198 means that “The probablity of getting this F_value by chance is 0.198”.
Since 0.198 > 0.05 we can safely say that getting this F_value is not statistically significant at p=0.05. So we are unable to reject the null hypothesis!