The Z-score and cut-off values
For Biology exam you got 85% and for Chemistry you got 70%. On which exam did you get a “better” score?

By SAJEEWA PEMASINGHE
To answer the above question of finding out at which exam you did better, it is almost meaningless to compare the raw scores (i.e. 85 and 70). In order to compare these scores, we need to put them in the same scale, or standardize them. That is where the Z-score comes into the picture. The Z-score tells you “how far ahead, or how far below your raw score is from the population mean, in standard deviation units“. Huh? What does that mean? We can get everything clarified by looking at an example.
For starters, the formula for converting a raw score like the 85 or 70 given above to its corresponding Z-score is ridiculously simple.
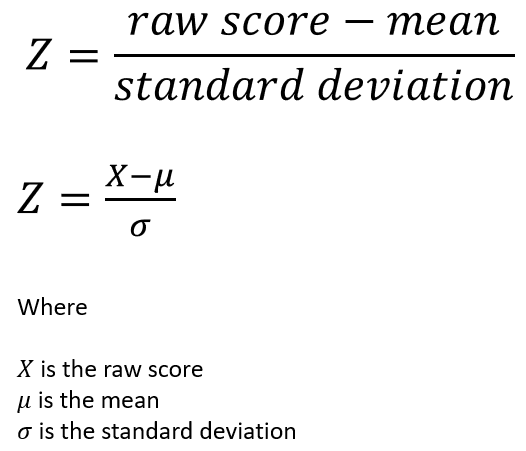
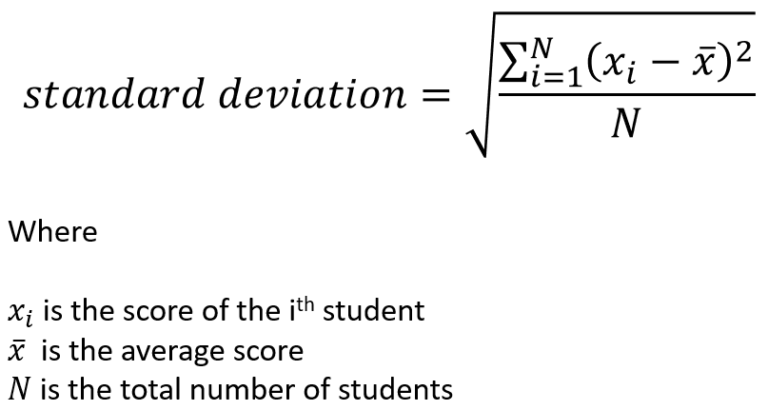
For our problem the ‘mean’ in the above formula, is the average score of the whole class for a given subject. For example, in the case of Biology, this can be found by adding up the scores of biology for each student and dividing by the number of students. Standard deviation for the distribution of scores can be calculated by the following formula.
Assuming the average (mean) score for biology was 70 with a standard deviation of 10 and the average score for chemistry was 50 with a standard deviation of 10 our Z-score calculation for the two raw scores would be as follows.
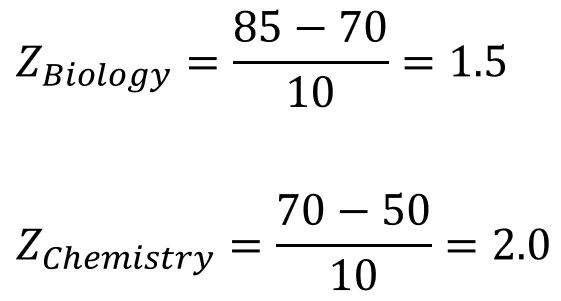
Aha.. So what do we have here? The calculation says that (although the raw score of 85 for biology is greater than the raw score of 70 for chemistry) the corresponding Z-score for chemistry is greater than the Z-score for biology which implies that actually the student has better results for chemistry than for biology with respect to the class average.
For biology, the student scored 1.5 standard deviations above the average and for chemistry, the student scored 2.0 standard deviations above the average.
A negative Z-score would indeed mean that the student scored below the average.
Calculating cut-off Z-scores
Consider the following scenario.
Question
Students’ examination scores for elementary statistics was found to be normally distributed with an average (mean) score μ of 50 and a standard deviation σ of 10. If the lecturer wishes to assign A grades to the best 15%, what is the cut-off Z-score and the corresponding cut-off raw score for A grade?
Answer
To answer this question we first have to know what a normal distribution is.
The mathematical definition (here we go, brace yourself 🙂 ) of a normal distribution is as follows.
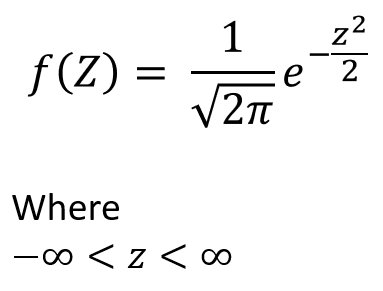
A continuous random variable X is said to follow a normal distribution, if its probability density function is of the following form,
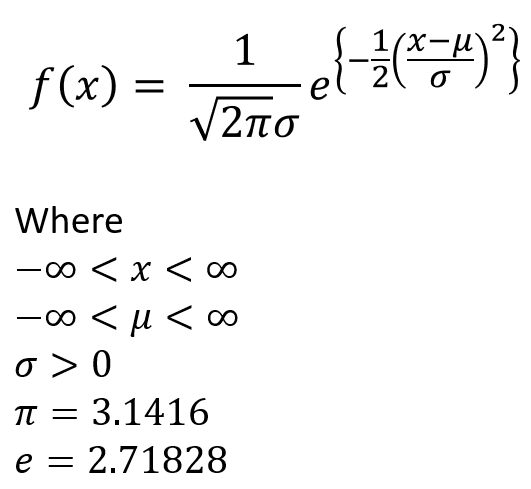
So how does all this connect with the Z-score? The answer is the standard-normal distribution. A normal distribution with mean μ = 0, and standard deviation σ = 1 is called a standard normal distribution. The standard normal random variable is usually denoted by Z and this Z is the same as the Z-score. So this is how the dots connect eventually.
The formula for the standard normal probability distribution could be written as
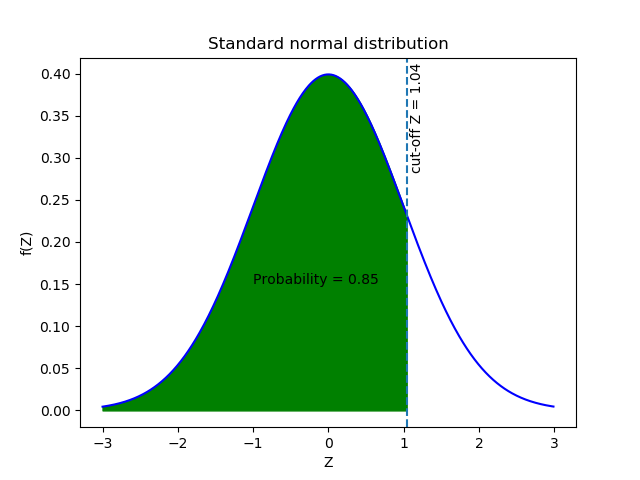
A graphical representation of the standard normal distribution is shown below.
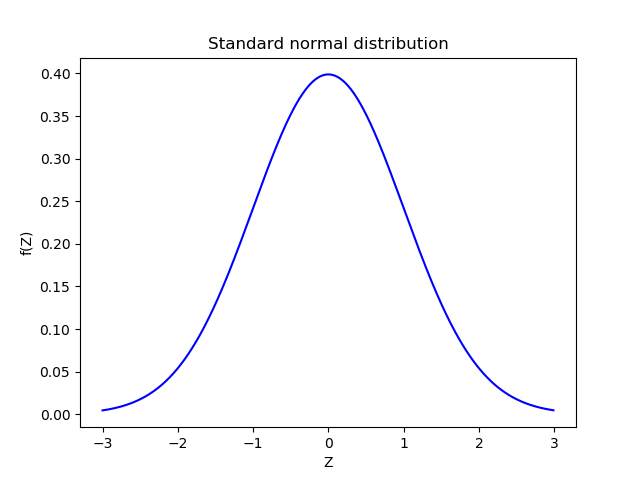
Areas under the standard normal curve are computed and are available in tables and can be used to compute the probabilities associated with the standard normal random variables. The area under the curve where a<Z<b gives the probability of Z taking a value between a and b. As the highest value probability can take is 1, the total area under the standard normal curve is also equal to 1.
Now we can go back to the question. Since the lecturer wants the Z-score that separates the top 15% of students, what we are really looking for is the Z-score that corresponds to a probability of 0.85. The Z-scores below that correspond to scores that don’t get an A grade. The Z-scores above that correspond to scores of the upper 15% of students that will receive an A grade. Now is the time to start reading the Z-score table to find the Z-score that corresponds to a probability of 0.85.
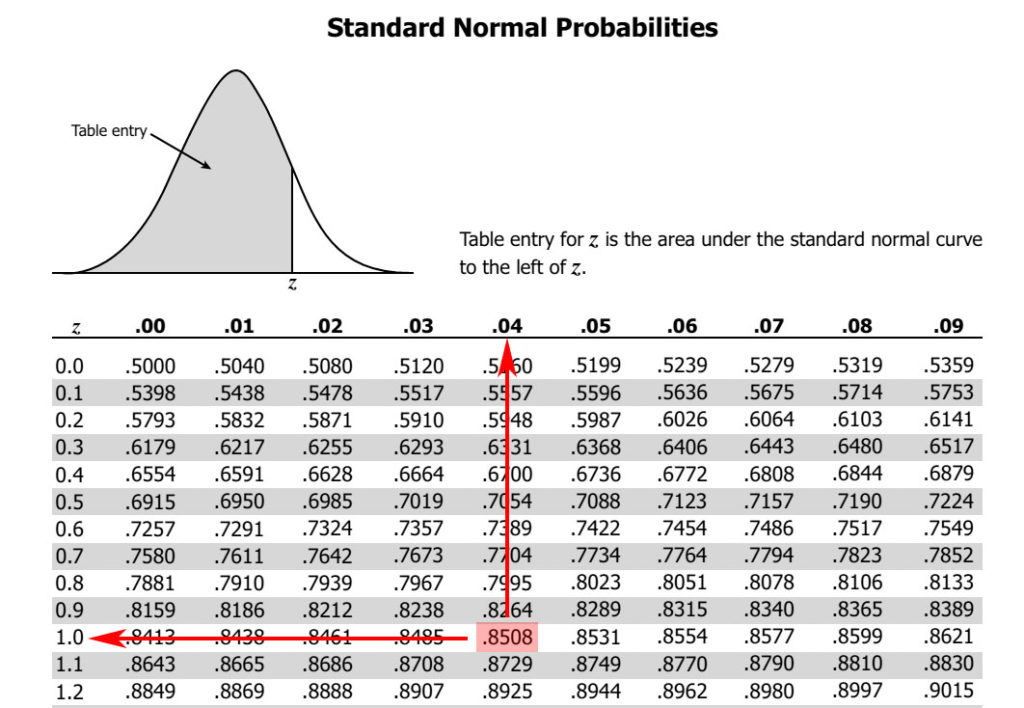
The Z table above shows that the Z-score corresponding to 0.85 probability is 1.04. So the cut-off Z-score is 1.04. How can we calculate the cut-off raw score? For that we can use the very first equation in this article that defines the Z-score and do the calculation as shown below.
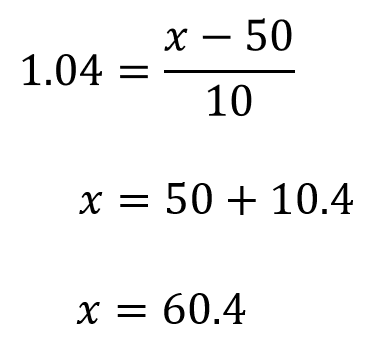
Hence the cut-off mark for an A grade is 60.
Good one dear…. Keep it up…
Thanks Suresh.
Very Nice!!!
I am glad you found it helpful.
If we want to give S grade for 2% of the students who got the lowest marks how we can find the cut off mark.
The Z-value corresponding to 2% probability is (-2.05). So for the example I have taken in the webpage, -2.05 = (x – 50)/10, which gives x = 29.5. So the cut-off score is 29.5
Nice explanation. Thank you. Keep up the good work.
Very Nice .. Thank you